
How new is this category?
Twelve months old, and it arrived all at once. In July 2025, ai visibility tools did 140 searches a month in the US. By June 2026 it was doing 1,000, with a twelve-month average of 1,600 and a year-over-year change of +1011%.
The rest of the cluster moved with it, and the numbers are worth reading together:
- ai visibility: 720 a month, +285%, keyword difficulty 26
- ai visibility tracking: 390 a month, +967%, difficulty 21
- ai brand visibility: 210 a month, +540%, difficulty 34
- ai visibility checker: 260 a month, +4700%, difficulty 5
All figures from DataForSEO Labs, US, English, pulled August 2026.
Two details in that table say more than the growth rates. The first is difficulty: 5 to 34 across a cluster where the incumbents have already arrived. semrush ai visibility toolkit alone does 3,600 searches a month as a branded query. A category with named vendors and single-digit ranking difficulty is a category where nobody has written anything worth linking to.
The second is price. Cost per click in this cluster runs from $32 to $66. For comparison, ai overviews, a query with a hundred times the volume, carries a CPC of $3.29. Nobody bids $66 for a curious reader. They bid it for a buyer with budget who has been told to fix something and does not yet know how.
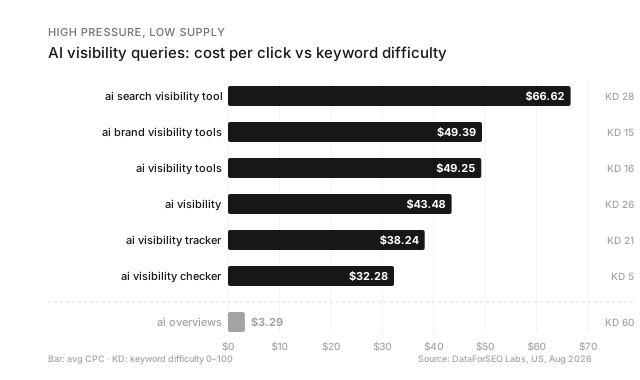
That combination, high commercial pressure and low editorial supply, is the most reliable signal in keyword research. It usually means the topic is hard to write well.
This one is hard to write well because the honest answer is uncomfortable.
Why do two tools give two different numbers for the same brand?
Because they are not measuring the same thing, and none of the differences are bugs.
Run the same brand through two AI visibility platforms in the same week and you will get two scores. The instinct is to assume one vendor is wrong. That instinct is expensive, because it sends you looking for the accurate tool, and the accurate tool does not exist. There are only tools that make different sampling decisions and mostly do not tell you which ones.
Five decisions sit under every score, and each of them moves the number.
The prompt set
A visibility score is a percentage of something. That something is a list of prompts the vendor chose. Change the list and the score changes.
Vendors build these lists differently. Some derive them from your keywords, which imports the assumption that people prompt the way they search, and they do not. Some generate them with a model, which means an LLM is inventing the test that another LLM is graded on. Some let you supply them, which is the most honest option and the one that makes cross-vendor comparison impossible.
If a tool will not show you its prompt list, the score is not a measurement. It is a rating.
Non-determinism
The same prompt to the same model on the same day returns different answers. This is how the technology works, not a defect in the measurement.
The consequence is that a single run is a sample of one from a distribution nobody has characterized. If a vendor queries each prompt once per cycle and reports the result as a number, they have converted noise into a decimal place. A brand that appears in 40% of runs can show up as present or absent depending on which single run got recorded.
Any tool reporting a visibility score without a variance figure is hiding its own error bars.
Personalization and memory
Answers depend on who is asking. Account history, saved memory, and prior turns in the same conversation all shape retrieval and phrasing. A vendor querying from a clean, logged-out, cookieless context is measuring a user who mostly does not exist. A vendor querying from a persistent account is measuring one specific fictional person.
Neither is wrong. They are different populations, and the scores are not comparable across them.
Geography and language
Retrieval is geo-sensitive, and so are the sources. A brand measured from a US IP in English is a different brand from the same one measured in German from Frankfurt. This matters most for exactly the companies buying these tools, which are usually multi-market.
What counts as a mention
Some tools count any appearance of the brand name. Some count only linked citations. Some weight by position in the answer. Some separate the brand being recommended from the brand being mentioned as a competitor in a list, and some do not.
That last distinction is the one that should worry you most, because being named as the expensive alternative and being named as the recommendation produce the same increment in a naive mention count.
Is non-determinism the whole problem?
No, and treating it as the whole problem is how teams end up measuring the wrong gate entirely.
Underneath the sampling issues sits a structural one. A brand can be retrieved and not cited: pages enter a candidate pool, passages get selected from inside it, and the two passes answer to different signals. Most visibility tools observe only the final answer, which is the output of gate two. They cannot see the pages that entered the pool and lost.
That means a falling score has at least two completely different causes with completely different fixes. Either you stopped being retrieved, which is a classic SEO and crawlability problem, or you are still retrieved and your passages stopped winning selection, which is a writing problem. The score is identical in both cases. The remediation is not.
A tool that reports presence without reporting retrieval is giving you a symptom and withholding the diagnosis.
What can you honestly measure right now?
Four things, in descending order of confidence.
Whether you appear at all, over enough runs to mean something. This is the most robust measurement available. Not a score, a rate: across N runs of a fixed prompt, you appeared in X of them. It is coarse, it is defensible, and it survives being questioned in a meeting.
Whether the appearance is a recommendation or a mention. Read the answers. Not a sample of the answers, the answers. This is manual, it does not scale past a few dozen prompts, and it is the single most informative hour you will spend on this.
Which sources the answer cited. The cited domains are visible in most surfaces and they tell you where the model went looking. If the same three third-party pages keep supplying your category, your competitor's ranking is not the problem, that intermediary is.
Direction over time on a frozen prompt set. If the prompt list does not change, quarter-over-quarter movement is interpretable even when the absolute number is not. Freeze the list, accept it is imperfect, and never edit it mid-measurement. The moment you add prompts, your history stops being a history.
Everything beyond those four is currently modelling, not measurement. Modelling is not worthless. It should just be labelled.
What does a minimum honest methodology look like?
Six steps. You can run it without buying anything, which is also the point.
- Fix a prompt set and write down why each prompt is in it. Thirty to fifty prompts covering the questions a buyer actually asks. Derive them from sales calls and support tickets, not from your keyword export. Version the file.
- Decide your population and declare it. Logged out or logged in, which country, which language, which models. Write it at the top of the report. Every number that follows is only valid inside that declaration.
- Run each prompt at least five times. Ten is better. This is the step people skip and it is the step that separates a measurement from an anecdote.
- Record presence, type, and citations for every run. Present or absent. Recommended, listed, or mentioned as a competitor. Which domains were cited. Raw rows, one per run, not an average.
- Report the rate and the spread. "Present in 34 of 50 runs, 68%, range 40% to 90% across prompts" is a finding. "68 visibility score" is a decoration.
- Cross-check one falling prompt against retrieval. Take a prompt where you dropped and check whether your page is still being retrieved at all. That is the gate-one versus gate-two question, and answering it turns a number into an action.
Run this quarterly. The cost is a day of work and it produces something a vendor dashboard cannot: numbers whose method you can defend when someone senior asks how they were made.
What do you put in a board deck without lying?
Three things, and one refusal.
Put in the rate with its denominator: appeared in 68% of 500 runs across 50 prompts, up from 54% last quarter. Put in the direction with the method held constant, and say explicitly that the prompt set was frozen. Put in one worked example, a single prompt where you moved from absent to recommended, with the answer text. Executives believe examples they can read more than indices they cannot audit.
The refusal is the composite score. If you present a single number that blends models, markets, prompt types, and mention types, you will be asked to move it, and you will not be able to explain what moving it means. Every index of this kind eventually becomes the thing being optimized, at which point it stops describing reality.
There is a shorter version of all of this. Once impressions stopped predicting clicks, the number kept getting reported anyway. The lesson here has the same shape: a visibility score does not predict revenue, and a chart that implies it does will be believed.
Where does this go?
Toward standardization, slowly, and probably not from the vendors.
The incentive structure does not favour it. A vendor whose score is comparable to a competitor's is a vendor competing on accuracy, which is expensive. A vendor whose score is proprietary is a vendor competing on narrative, which is not. semrush ai visibility toolkit at 3,600 searches a month tells you the suites have already entered, and large suites standardize when customers make comparability a purchase condition.
So make it one. Ask any vendor three questions before you pay: show me the prompt list, tell me how many runs per prompt, and show me the variance. A tool that answers all three is measuring something. A tool that answers none is selling you a number.
The category grew a thousand percent in a year because the need is real. The methods have not caught up, and the gap between the need and the methods is currently being filled with confidence.
Ask for the denominator.